Welcome to the FamilyTHINK Dashboard
This is where you will view your assessment results alongside those in your family and or inner circle.
The purpose of the dashboard is to create clarity. It allows you to see where each person is in their life cycle and work together to close gaps over time.
- Gap 1 is the difference between where you are and where you think you are.
- Gap 2 is revealed once Gap 1 is closed and focuses on where you are going.
- Gap 3 is the execution gap and is closed through consistent use of the FamilyTHINK Dashboard and SMART Goal System.
This system is built on understanding and alignment, allowing you and your inner circle to work together to raise your overall family score over time.
Below are sample views of the FamilyTHINK Dashboard and Finance Pillar pages available after completing the assessment and becoming a FamilyTHINK member.
Dashboard View:
This view shows individual results, member names, relationships, assessment IDs, pillar scores, overall scores, and life cycles. It becomes your central place to track progress, alignment, and trends across your family or inner circle over time.
Pillar View:
Each pillar includes its own detailed breakdown of questions, scores, averages, and progression models. These pages help reveal strengths, recurring gaps, and areas where intentional growth and accountability may be needed.

Click 👆🏾 the image above to review a sample Assessment Readout
Sample Familythink Dashboard - Homepage

Get a preview of what your dashboard will look like
This dashboard is made up of several sections designed to help you better understand your results, track progression, and view trends across your family or inner circle. Reference the information below to learn what each section represents and how the dashboard works.
Dashboard homepage Reference Guide
1. Family Name
This section identifies the family the dashboard represents.
2. Checkbox
By selecting TRUE, the person’s assessment scores are included in the overall family score. This allows you to see how each individual impacts the family’s total results.
3. The Goal
This section explains the purpose of the dashboard: to gather meaningful data over time so families can better understand patterns, growth, and trends across generations.
4. Assessment ID
The Assessment ID is used to pull assessment results into the dashboard. Once entered, the system loads pillar scores, overall scores, and life cycle information. With permission, additional family assessments and annual reassessments can be added to track year over year trends.
5. Name
After entering the Assessment ID, the individual’s name is automatically populated into the dashboard.
6. Generation & Title
This dropdown section identifies the person’s relationship to the primary dashboard owner. Each dashboard is unique to the owner, and all family relationships are compared back to the primary person listed in the first row.
7. Date of Birth & Calculated Age
Enter the individual’s date of birth and the dashboard will automatically calculate their age.
8. Assessment Results
This section automatically displays the assessment date, pillar scores, and overall score once the Assessment ID is entered. It provides a quick snapshot of how each family member is currently doing.
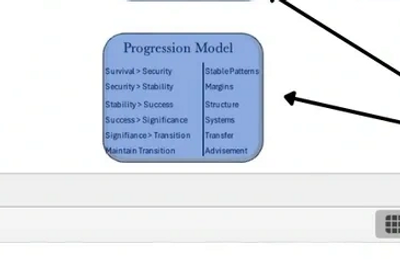
9. Scales and Progression Model
The scales explain the score ranges and associated life cycles. The Progression Model outlines how individuals and families can move from one level to the next over time.
10. Family Overview
This combines all included assessment scores into a single family score. As additional family members are added, the dashboard updates to reflect the overall family picture and generates a general family readout based on the combined results.
Sample Familythink Dashboard - Finance Pillar
Get a preview of what your finance pillar dashboard will look like
The Finance Pillar page provides a deeper view into individual and family financial patterns, averages, and progression. Reference the information below to better understand how each section of the pillar dashboard is organized and scored.
Dashboard Finance Pillar Reference Guide

1. Finance Questions
This section displays the 10 Finance Pillar assessment questions used to evaluate financial habits, preparedness, stability, and long term planning across the family.
2. Finance Overview
This section provides a brief explanation of the Finance Pillar and highlights how financial behaviors influence long term growth, stability, and decision making within the family. The larger score is the average family score in under this pillar.
3. Data Collection: Finance Focus Areas
This section explains how each answer choice is scored from 0–5. It provides the grading scale used to calculate Finance Pillar scores and helps show what progression looks like from one level to the next.
4. Pillar Navigation Tabs
These tabs allow you to move between the Finance, Social, Health, and Time Pillars. Each pillar contains its own questions, scoring system, and progression tracking.
5. Average Family Pillar Score
This section combines all included Finance Pillar scores into one average family score. As more family members are added, the score automatically updates to reflect the overall financial picture of the family.
6. Family Member Columns
The names across the top automatically populate based on the order entered on the main dashboard. Each column displays that individual’s answers and Finance Pillar score.
7. Average Score Row
This row shows the average score for each finance question across all included family members. It helps identify shared strengths and recurring financial gaps within the family.
8. Assessment Responses
This section displays each person’s answer values for every Finance Pillar question. These scores are automatically pulled from the assessment and used to calculate averages, trends, and overall family scoring.